
Building fast SQL queries can often benefit from well-written SQL and appropriately structured indexes. But there comes a day in the life of a growing SaaS where those end-user reports and analytics become painfully slow.
Maybe you’ve tried or have considered common solutions to this problem:
- Increase the size of your database VM/service so it has tons of CPU resources and RAM
- Read-replicas in production
- Partitioning huge database tables
- Sharding your database
These solutions can increase the costs of running your SaaS, add complexity to your infrastructure or add more operational risk to operating your database. These options can also push toward a mismatch between your local development and production database configuration, which is most likely undesirable, especially if these options are unnecessary.
There’s a potential solution that doesn’t involve these risks. It takes a bit of thoughtful design, techniques, and code: aggregation or rollup tables.
In this article, you’ll learn how rollup tables work and how to implement them using .NET, PostgresSQL and Coravel for job scheduling.
All the code is available at this GitHub repo.
Oh ya, this article is part of 2024 C# Advent!
What’s The Problem?
Consider this mock web application dashboard:
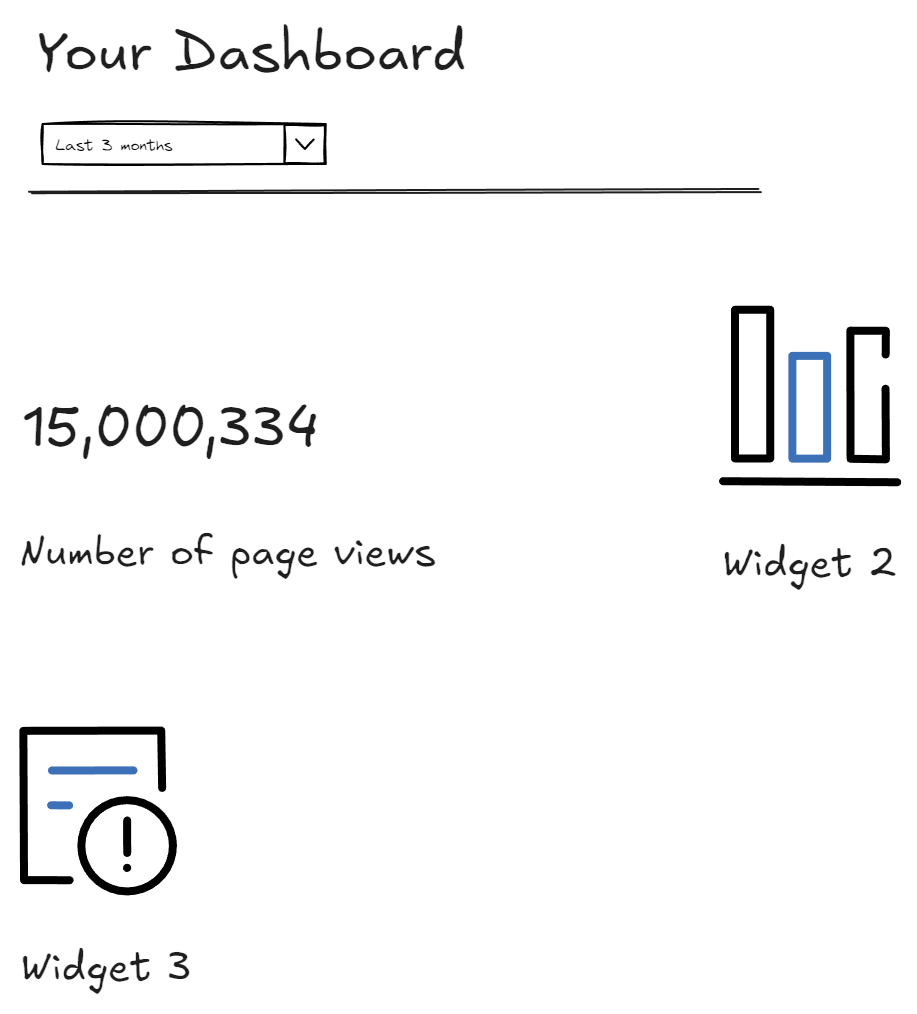
The query that backs the first widget might look something like this:
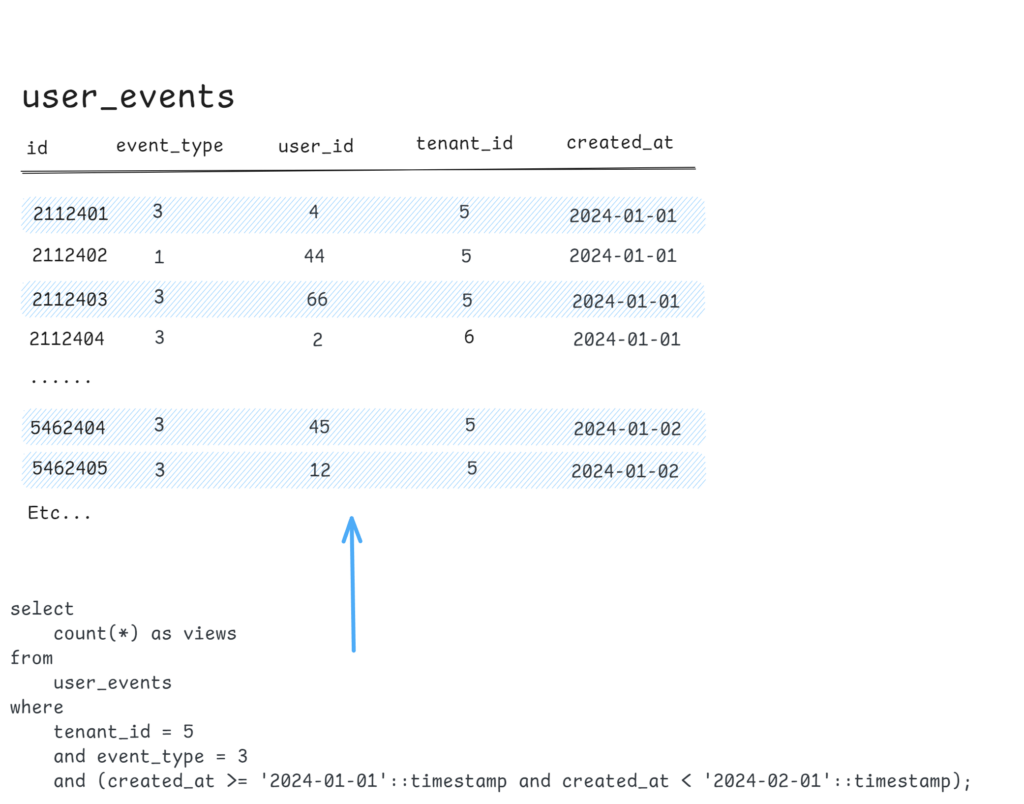
select count(*) as views
from user_events
where tenant_id = :tenant_id
and event_type = 3 -- 3 is a enum for "page viewed"
and (created_at >= :start_date and created_at < :end_date);
A sensible index for this query might be:
create index user_events_dashboard_index on user_events using btree (tenant_id, event_type, created_at);But still, some of your biggest customers are waiting multiple seconds to get their dashboard to load because there’s just so much data!
What should you do?
- Pay for a bigger server to put your database on?
- Add a read-replica?
But what if…
- Those don’t work?
- You land another huge customer that soon throws these solutions out the window?
- These solutions blow your budget?
What Is A Rollup Table
A rollup table is when you pre-aggregate an aggregation like count(), sum(), etc., into broader buckets of time. This can result in your queries being orders of magnitude faster.
Here’s what the original table & query look like:
A rollup table for this query might look like this:
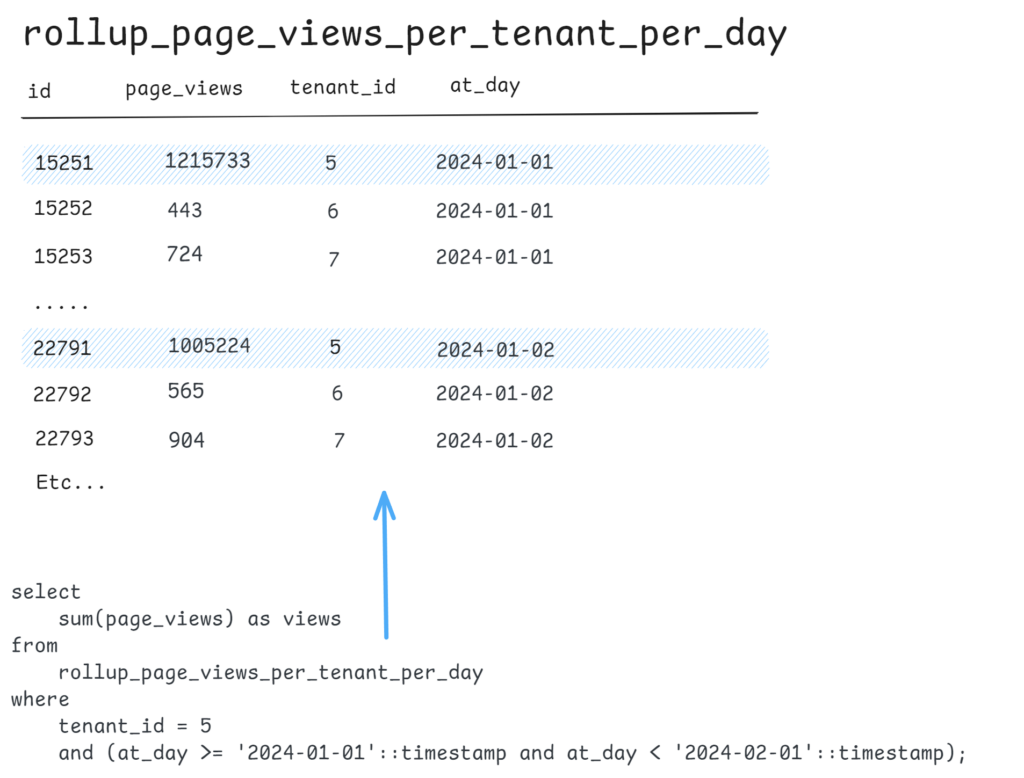
Instead of aggregating millions+ of individual records at query time, this has pre-counted page views per tenant for each day. Now, this dashboard widget’s SQL query will only read and process 1 record/tuple per day as requested by the report!
The trade-off is that your report cannot work in intervals smaller than your chosen time bucket. But, you can create rollup tables with a smaller time bucket if that’s an issue.1
Building A Rollup Table And Supporting Code With .NET
Let’s see how to build this using .NET, PostgreSQL and Coravel.
The Proof Is In The Pudding
First, I’ll show you the difference in performance between the first cold query for each approach. Given my randomly generated test data, I had to run all these queries during the same execution of the application.
// First run
{"pageViews":[1722835],"elapsed":"3026.6793 ms"}

// Second run
{"pageViews":[1722835],"elapsed":"151.7914 ms"}
Vs.
// First run
{"pageViews":[1722835],"elapsed":"19.2124 ms"}

// Second run
{"pageViews":[1722835],"elapsed":"0.8818 ms"}
The results speak for themselves.
Oh ya, here’s a comparison of the table and index sizes:
| Relation | Size |
| user_events_dashboard_index | 369 MB |
| user_events | 345 MB |
| user_events_pkey | 129 MB |
| —- | —- |
| rollup_page_views_per_tenant_per_day_pkey | 16 kB |
| rollup_page_views_per_tenant_per_day_unique_index | 16 kB |
| rollup_page_views_per_tenant_per_day | 8192 bytes |
Having smaller tables and indexes is key to making your analytical reports blazing fast.2
High-Level Considerations
Again, I’ve created a GitHub repo with all the code I used to make this article. You can clone it and with a few terminal commands run the thing yourself.
Let’s step through some high-level considerations. The rollup table is a pre-aggregation from the raw events table. You’ll have to keep the rollup table up-to-date somehow since there’s always new data coming in.
Note: For those paying attention, we’re essentially doing event sourcing where the rollup table is really a projection.
By using Coravel, we can schedule a job to run every few seconds and aggregate data from the user_events table.
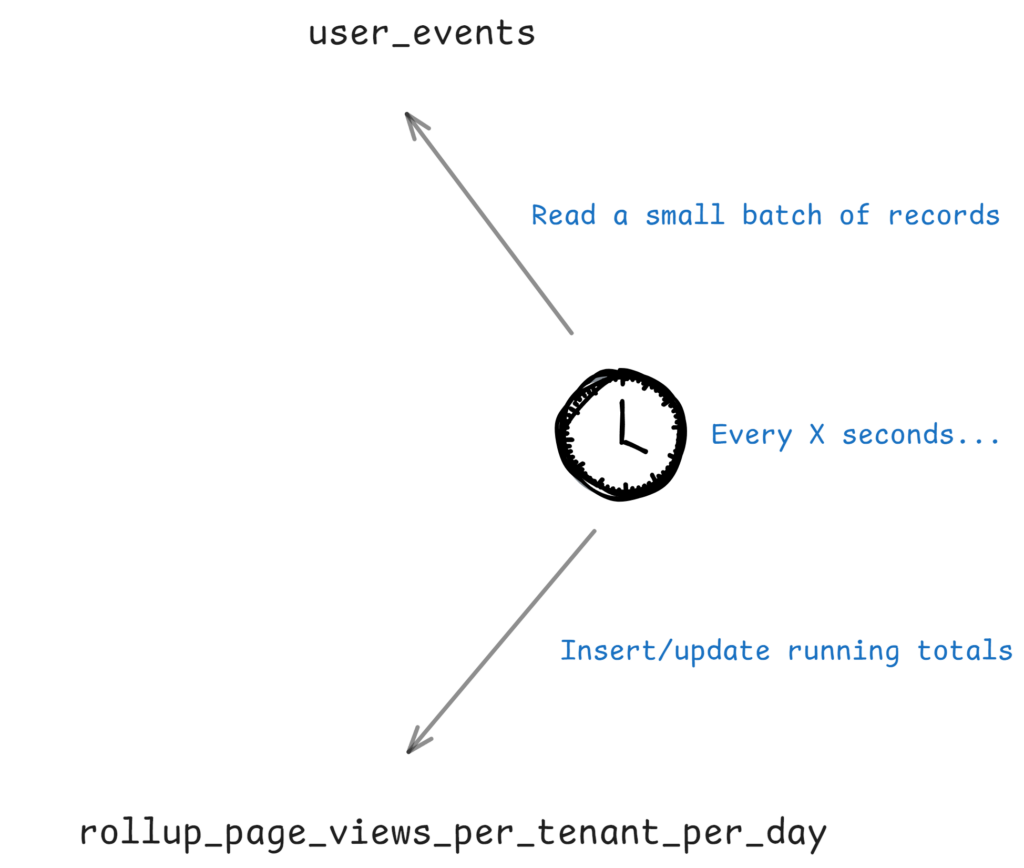
In production systems, you’ll want to make sure you’re processing small batches of records so as to not (a) have long transactions and (b) spike your database resources.
Ultimately, the best numbers depend on your system. In this sample though, we’ll be running the job every second with batches of 1 million records at a time. This is probably not a great configuration for production when many concurrent queries are happening, but it’s fine for our sample application!
Here’s Some Code… Finally!
Alright, let’s start looking at some code!
First, we’re building the base tables: tenants and user_events. We’ll go through the SQL to build the tables, but in the .NET project these are all in the Migrations.cs file.
create table tenants (
    id bigint primary key generated always as identity,
    name text not null
);
create table user_events (
id bigint primary key generated always as identity,
event_type int,
tenant_id bigint references tenants (id) on delete cascade,
created_at timestamptz not null
);
create index user_events_dashboard_index on user_events using btree (tenant_id, event_type, created_at);We’ll want to insert some dummy data into both of these tables:
insert into tenants (name) values ('1'), ('2'), ('3'), ('4'), ('5'), ('6');create extension if not exists "pgcrypto";
-- This will generate 1 million events.
insert into user_events (event_type, tenant_id, created_at)
select
-- Generate a random event type between 1 and 3
floor(random() * 3::integer + 1),
-- Pick a tenant at random
floor(random() * 6::integer + 1),
-- Generate 10 events per seconds starting from 2024-01-01
'2024-01-01 00:00:00.000'::timestamptz + concat(gen * .1, '1 second')::interval
-- On a codespaces instance, this is enough data to prove the point.
from generate_series(1, 1000000) gen;
-- This will simulate that tenant 6 has ALOT more data than other tenants.
insert into user_events (event_type, tenant_id, created_at)
select
floor(random() * 3::integer + 1),
6,
'2024-01-01 00:00:00.000'::timestamptz + concat(gen * .1, '1 second')::interval
from generate_series(1, 5000000) gen;Code To Build Rollup Table
Here’s code to create the rollup table:
create table rollup_page_views_per_tenant_per_day (
    id bigint primary key generated always as identity,
    page_views bigint default(0),
    tenant_id bigint references tenants (id) on delete cascade,
    at_day timestamptz not null
);

create unique index rollup_page_views_per_tenant_per_day_unique_index
on rollup_page_views_per_tenant_per_day (tenant_id, at_day);


create table rollup_metadata (
    id bigint primary key generated always as identity,
    table_name text not null,
    last_id bigint default(0)
);

insert into rollup_metadata (table_name, last_id)
values ('rollup_page_views_per_tenant_per_day', 0);
Okay. We need to talk about the rollup_metadata table.
As that scheduled job is aggregating batches of records, you’ll need somewhere to store the last id you’ve processed so the next batch of processing can continue from where you left off.
That’s all this table is for.
Aggregating Records In A Scheduled Job
Using Coravel, we’ll need to schedule a job that will periodically suck in records and spit out some pre-aggregation. In Program.cs:
scheduler
    .Schedule<AggregateRollupPageViewsPerTenantPerDay>()
    .EverySecond()
    .PreventOverlapping(nameof(AggregateRollupPageViewsPerTenantPerDay));
By using PreventOverlapping we ensure that only 1 instance of this job is running at any given moment. If you have multiple application instances, then some kind of distributed lock will be needed as I’ve written here.
Or, in the aggregation query (see below), you could add a for update clause at the beginning of the entire statement.
Moving on, the invocable we need to build:
using System.Data.Common;
using Coravel.Invocable;
using Dapper;
namespace RollupsPostgresqlDotnet.Invocables;
public class AggregateRollupPageViewsPerTenantPerDay : IInvocable
{
private readonly DbConnection connection;
private static readonly int batchSize = 1_000_000;
public AggregateRollupPageViewsPerTenantPerDay(DbConnection connection)
{
this.connection = connection;
}
public async Task Invoke()
{
var numProcessed = await connection.QuerySingleAsync<long?>(@"
[insert big SQL statement here...]
", new {
batchSize
});
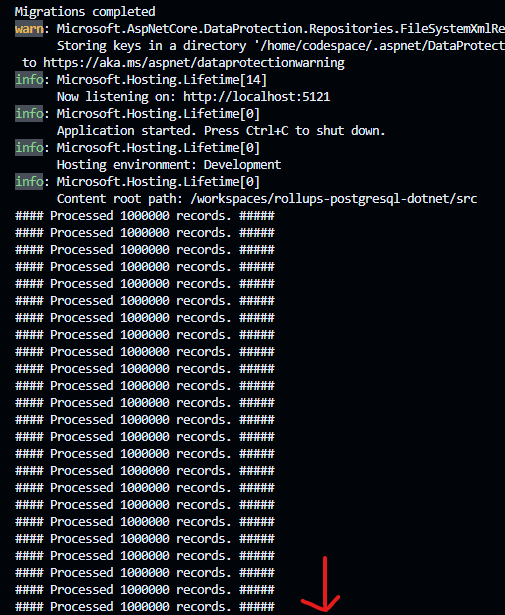
Console.WriteLine($"#### Processed {numProcessed} records. #####");
}
}That’s the skeleton. The SQL is quite a beast, so let’s dig into that separately.
The Big SQL
Here’s the complex piece – the aggregation query:
-- Grab the last id that this aggregation has processed.
with last_id as (
    select last_id as id
    from rollup_metadata
    where table_name = 'rollup_page_views_per_tenant_per_day'
    limit 1
),

-- Get the last id of the records that we will process right now.
next_last_id as (
    select id
    from user_events
    where id <= (select id + @batchSize from last_id)
    order by id desc
    limit 1
),

-- This will perform the rollup aggregation for the next batch of records.
do_aggregation as (
    insert into rollup_page_views_per_tenant_per_day (page_views, tenant_id, at_day)
    select
        count(*) as page_views,
        tenant_id,
        date_trunc('day', created_at) as at_day
    from user_events
    where
        event_type = 3
        and id > (select id from last_id) and id <= (select id from next_last_id)
    group by tenant_id, at_day
    order by at_day asc

    on conflict (tenant_id, at_day)
        do update set
            page_views = rollup_page_views_per_tenant_per_day.page_views + excluded.page_views

    returning *
),

-- Update the metadata table with the last id that we have processed.
update_metadata_table as (
    update rollup_metadata
    set last_id = (select id from next_last_id)
    where table_name = 'rollup_page_views_per_tenant_per_day'

    returning *
)

select (select id from next_last_id) - (select id from last_id) as num_processed

;
One of the reasons I love PostgreSQL is that you can perform inserts, updates and deletes from inside a CTE. This opens up a whole universe of cool stuff you can do.
I’ve tried to put a few helpful comments in the code, but here are a few things to call out:
- Using
date_truncis like doingfloorbut on a date. You can specify the interval to truncate to. For example, any value fed todate_trunc('day', x)within the day of2024-01-01will be truncated to2024-01-01 00:00:00. - Because there’s an
unique indexon the rollup table, you can use the PostgreSQL operationon conflict. It’s likemerge. But different.3 - In some of the CTEs we use
returning *. You can use the values coming from these CTEs to return more metrics to your C# code if you want.
Controller Actions: The Queries
Here are the two queries for each approach written in a hardcoded fashion because this is sample code:
public async Task<IActionResult> PageViewsFor2024([FromServices] DbConnection connection)
{
    var _2024 = new DateTime(2024, 1, 1);
    var startTime = Stopwatch.GetTimestamp();

    var pageViews = await connection.QueryAsync<long>(@"
        select
            count(*) as views
        from
            user_events
        where
            tenant_id = 6
            and event_type = 3 -- 3 is a enum for ""page viewed""
            and (created_at >= @start and created_at < @end);
    ", new {
        Start = _2024,
        End = _2024.AddYears(1)
    });

    var elapsedTime = Stopwatch.GetElapsedTime(startTime).TotalMilliseconds;

    return Json(new {
        PageViews = pageViews,
        Elapsed = elapsedTime + " ms"
    });
}

public async Task<IActionResult> PageViewsFor2024Rollup([FromServices] DbConnection connection)
{
    var _2024 = new DateTime(2024, 1, 1);
    var startTime = Stopwatch.GetTimestamp();

    var pageViews = await connection.QueryAsync<long?>(@"
        select
            sum(page_views)
        from
            rollup_page_views_per_tenant_per_day
        where
            tenant_id = 6
            and (at_day >= @start and at_day < @end);
    ", new {
        Start = _2024,
        End = _2024.AddYears(1)
    });

    var elapsedTime = Stopwatch.GetElapsedTime(startTime).TotalMilliseconds;

    return Json(new {
        PageViews = pageViews,
        Elapsed = elapsedTime + " ms"
    });
}
In a real production controller action, you would be accepting parameters from the user (like the date range of the report). If this was a report for an application admin, maybe they would have the ability to select which tenant_id to run the report for too.
Or, you could change the query here to return the counts for all tenants ordered by the top page views.
In either case, not much would have to change.
Bonus: Building Another Report!
Great news, my sample repo has the other query I mentioned: return the page views for all tenants ordered by the top page views!
Here’s what the controller action looks like:
public async Task<IActionResult> PageViewsFor2024RollupAdmin([FromServices] DbConnection connection)
{
    var _2024 = new DateTime(2024, 1, 1);
    var startTime = Stopwatch.GetTimestamp();

    var viewModels = await connection.QueryAsync<PageViewsRollupAdminViewModel>(@"
        select
            sum(page_views) as views,
            tenant_id as tenantId
        from
            rollup_page_views_per_tenant_per_day
        where at_day >= @start and at_day < @end
        group by tenant_id
        order by views desc;
    ", new {
        Start = _2024,
        End = _2024.AddYears(1)
    });

   var elapsedTime = Stopwatch.GetElapsedTime(startTime).TotalMilliseconds;

    return Json(new {
        Data = viewModels,
        Elapsed = elapsedTime + " ms"
    });
}
How fast do you think this is going to be? I mean, the user_events table has 6 million records and was taking seconds to run cold for 1 tenant. Now, we’re adding more overhead by having to calculate the numbers for all tenants and then order them.
Considering our test data only has 6 tenants…. this isn’t very realistic. So there’s no point in comparing numbers here. But here’s what that query returns cold:
{
    "data": [
        {
            "views": 1722912,
            "tenantId": 6
        },
        {
            "views": 55655,
            "tenantId": 1
        },
        {
            "views": 55624,
            "tenantId": 4
        },
        {
            "views": 55605,
            "tenantId": 3
        },
        {
            "views": 55313,
            "tenantId": 5
        },
        {
            "views": 55280,
            "tenantId": 2
        }
    ],
    "elapsed": "110.9783 ms"
}
You’re free to take the sample code and add more tenants, increase the number of records generated and test things out for yourself!
Well… okay… let’s just do it here right now😁.
Let’s generate 100 tenants and 50 million records to make this a bit more realistic. Here are snippets of the changes I made:
insert into tenants (name)
select gen
from generate_series(1, 100) gen;
var startTime = Stopwatch.GetTimestamp();
// This will generate 50 million events.
await connection.ExecuteAsync(@"
create extension if not exists ""pgcrypto"";
insert into user_events (event_type, tenant_id, created_at)
select
-- Generate a random event type between 1 and 3
floor(random() * 3::integer + 1),
-- Pick a tenant at random
floor(random() * 100::integer + 1),
-- Generate 10 events per seconds starting from 2024-01-01
'2024-01-01 00:00:00.000'::timestamptz + concat(gen * .1, '1 second')::interval
from generate_series(1, 50000000) gen;
", commandTimeout: 0); // E.g. this is going to take a while...
var elapsedTime = Stopwatch.GetElapsedTime(startTime).TotalSeconds;
Console.WriteLine($"Generated 100 million events in {elapsedTime} seconds");I also added some code to record how long generating the event data would take:
Generated 100 million events in 902.0385465 secondsIt also took a bit longer to let the scheduled jobs fill up the rollup table too…
I won’t post the entire JSON response since it has 100 records. I took the top 5 records and removed the rest to make this easier to read:
{
    "data": [
        {
            "views": 167581,
            "tenantId": 10
        },
        {
            "views": 167575,
            "tenantId": 71
        },
        {
            "views": 167464,
            "tenantId": 63
        },
        {
            "views": 167409,
            "tenantId": 16
        },
        {
            "views": 167409,
            "tenantId": 49
        }
    ],
    "elapsed": "103.6067 ms"
}
So reading a year’s worth of data for our 100 tenants and then ordering them by highest views took 103 ms cold. Running this again took 2 ms.
My guess is that trying to run this report against the user_events table cold would take tens of seconds or even minutes to run against the database setup here. PostgreSQL would have a fun time reading and processing all those 50,000,000 records from disk (unless you have a really expensive DB server 😀).
Here’s a screenshot of the sizes of things in my database at this point:
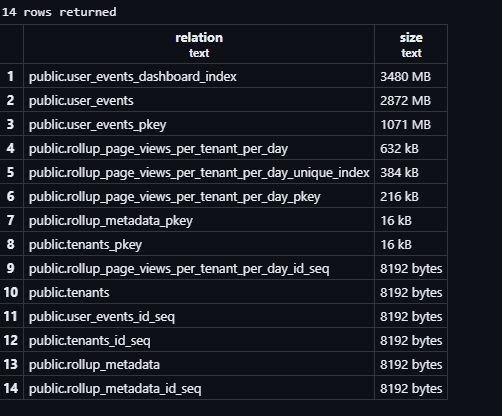
I’d like to point out the size of the user_events table. That’s almost 3 GB. Compare that to the rollup table which is 632 KB.
That’s a massive difference. But, chances are you would want to build a few different rollup tables to support different reports. Yes.
But, you’d need to build ~4,746 separate rollup tables this size to match the same storage as the 1 raw events table. Well… the numbers are actually further skewed by the sizes of the indexes. We can agree that this is a huge difference in size 🤷.
Conclusion
I hope you learned something from this article!
Using this approach to build some analytical reports is pretty powerful. While this is a simple example, you can probably imagine how doing rollups using more than 1 dimension (e.g. grouping by tenant and user, etc.) could help your organization and users.
Once you’ve built the first rollup report, then the next one becomes easier too 👍.
Here are a few extra closing tips around this approach:
- By using a feature flag to release the UI, you can let your aggregation jobs slowly fill up the rollup tables before releasing any user-facing functionality.
- You can also play around with the aggregation batch size and schedule by starting with low numbers and ramping things up slowly. This can help to mitigate the risk of unintentionally overloading your database.
- You can always create multiple rollup tables against the same data but with different time buckets (e.g. hourly, daily and monthly for the same report).
- Rollup tables can have more than 1 dimension. Ex: rolling up by
event_typeandtenant_idor other columns you might have. Keep in mind the more dimensions you add, the slower these queries will be. But still much faster than querying theuser_eventstable. Trade-offs 🙂.
Footnotes
- It’s also an option to create multiple rollup tables for the same report but with different time buckets. For example, report X could have hourly, daily and monthly rollup tables. Depending on the query required from the report / user’s parameters, you can choose which rollup table to query to make sure things are performant. ↩︎
- In a production database where this query is already slow, it’s probably because the rows needed for this query aren’t being cached enough to keep this query fast. If concurrent users are running this report with different combinations of parameters, then you’ll mostly have “cold” queries. That is a query where most of the data it needs to process is not warm in cache but is cold on disk. Loading a tiny amount of data from disk is quick. Queries using the rollup table are blazing fast even when cold for this reason. Also, the rollup table’s data will have a higher chance of being cached in production since the chances of having this data evicted is much less since it’s so tiny. ↩︎
- While
on conflictrequires a unique constraint,mergedoesn’t. In this case,on conflictworks fine since using theunique indexis what we want/need. However, in scenarios having concurrent inserts (not this case),on conflictis a better option as it checks concurrency record by record and won’t fail due to concurrent inserts.mergechecks the source against the target before performing its operations. This can lead to failures if a concurrent insert occurs whilemergeis operating after it performs the check.
From the docs:
You may also wish to consider usingINSERT ... ON CONFLICTas an alternative statement which offers the ability to run anUPDATEif a concurrentINSERToccurs. There are a variety of differences and restrictions between the two statement types and they are not interchangeable. ↩︎
6 replies on “Blazing-Fast Analytical Queries With .NET & PostgreSQL”
Heya,
Thanks for great and informative article!
The part that I don’t quite understand is why are you using
select
sum(page_views)
and not just
select
page_views
Why is sum important here?
Thanks 🙂
Hey Vid! The difference is that using
sum()will give the total count across the entire time frame. If you don’t usesum(), then the query will output the counts per time bucket as separate rows.That is actually a really useful use case though – as you could output the counts per time bucket and plot them on a UI chart, for example. That would be the next step to this article: how to plot aggregated data on a UI.
Hopefully that helps!
Would be great if you could compare to pg_duckdb powered queries.
Hey Giorgi! I probably won’t write any articles comparing the two, but DuckDB is def. more geared towards use by data scientists in larger local analytics analysis vs. a real-time in-product analytics dashboard scenario.
Thanks for the comment!
Just check TimescaleDB extension for PostgreSQL.
https://github.com/timescale/timescaledb
For sure! That’s an option for any organization where the analytics portion of their business might warrant using the extension 👍.
Using a PG native approach does have other benefits though. For example, in this example, you are able to C# to perform the aggregation calculations. If using timescale continuous aggregates, for example, you would be limited to aggregating directly from tables using SQL. There could be cases when using C# would be a better option for various reasons (ex. you can aggregate from many sources like PG tables, APIs, etc.)
Thanks for the input!